Understand
 16 min read
The Open Digital Traceability Ecosystem

In supply chain management, "digital traceability" refers to "the use of digital tools and systems to track product history, application, and location throughout the supply chain"1. At Platformable, we seek to work with industry associations, voluntary sustainability standards bodies, multilateral organisations, and supply chain actors to map the traceability ecosystem and identify opportunities to participate in creating and using data responsibly and ethically to support sustainability and equity goals.
Understanding the traceability ecosystem
At a high level, the traceability ecosystem can be viewed as various stakeholders working in relationships with each other (the inner circle in the following diagram). They make use of digital public infrastructure (the next circle out) to deliver on due diligence and other regulatory compliance goals — like the European Union Deforestation Regulation (EUDR) and EU and national based sustainability and financial disclosure reporting regulations — and to enable wider data use cases. These stakeholders then work collaboratively using these tools across the data life cycle (the outer circle).

How value flows across the traceability ecosystem
At a more detailed level, we can view the traceability ecosystem model as a map of all stakeholders that:
- Define the ecosystem rules (that is, set the context for the ecosystem),
- Are involved in collecting and generating data (data holders, capacity builders and those that consume the data in some way such as digital tools providers), so that
- Data end users can make use and reuse of the data, which in turn ensures that
- Society, local economies and the environment benefit (indirect beneficiaries).
At its most fundamental level (as shown at the bottom of the following diagram), value flows from left to right in this model: the context setters establish the ecosystem rules of engagement and the data holders/capacity builders collect and improve the quality of data. This generates value for supply chain actors; and the use of data to drive business activities benefits society, economies, and the environment.
When ecosystem activities are positive, value can also flow between ecosystem stakeholders at any point. For example, sustainability systems, multilateral organisations, and digital tools providers can make it easier for primary producers to collect and manage data. This can generate additional value for primary producers by reducing their burden and by creating new monetisation or market access opportunities. Or industry, member, and trader associations may identify gaps in the ecosystem and provide new products and services that increase value for other ecosystem stakeholders. Participation by various stakeholders and the generation of value for indirect beneficiaries then flows back to benefit governments and improves the work of regulatory bodies.
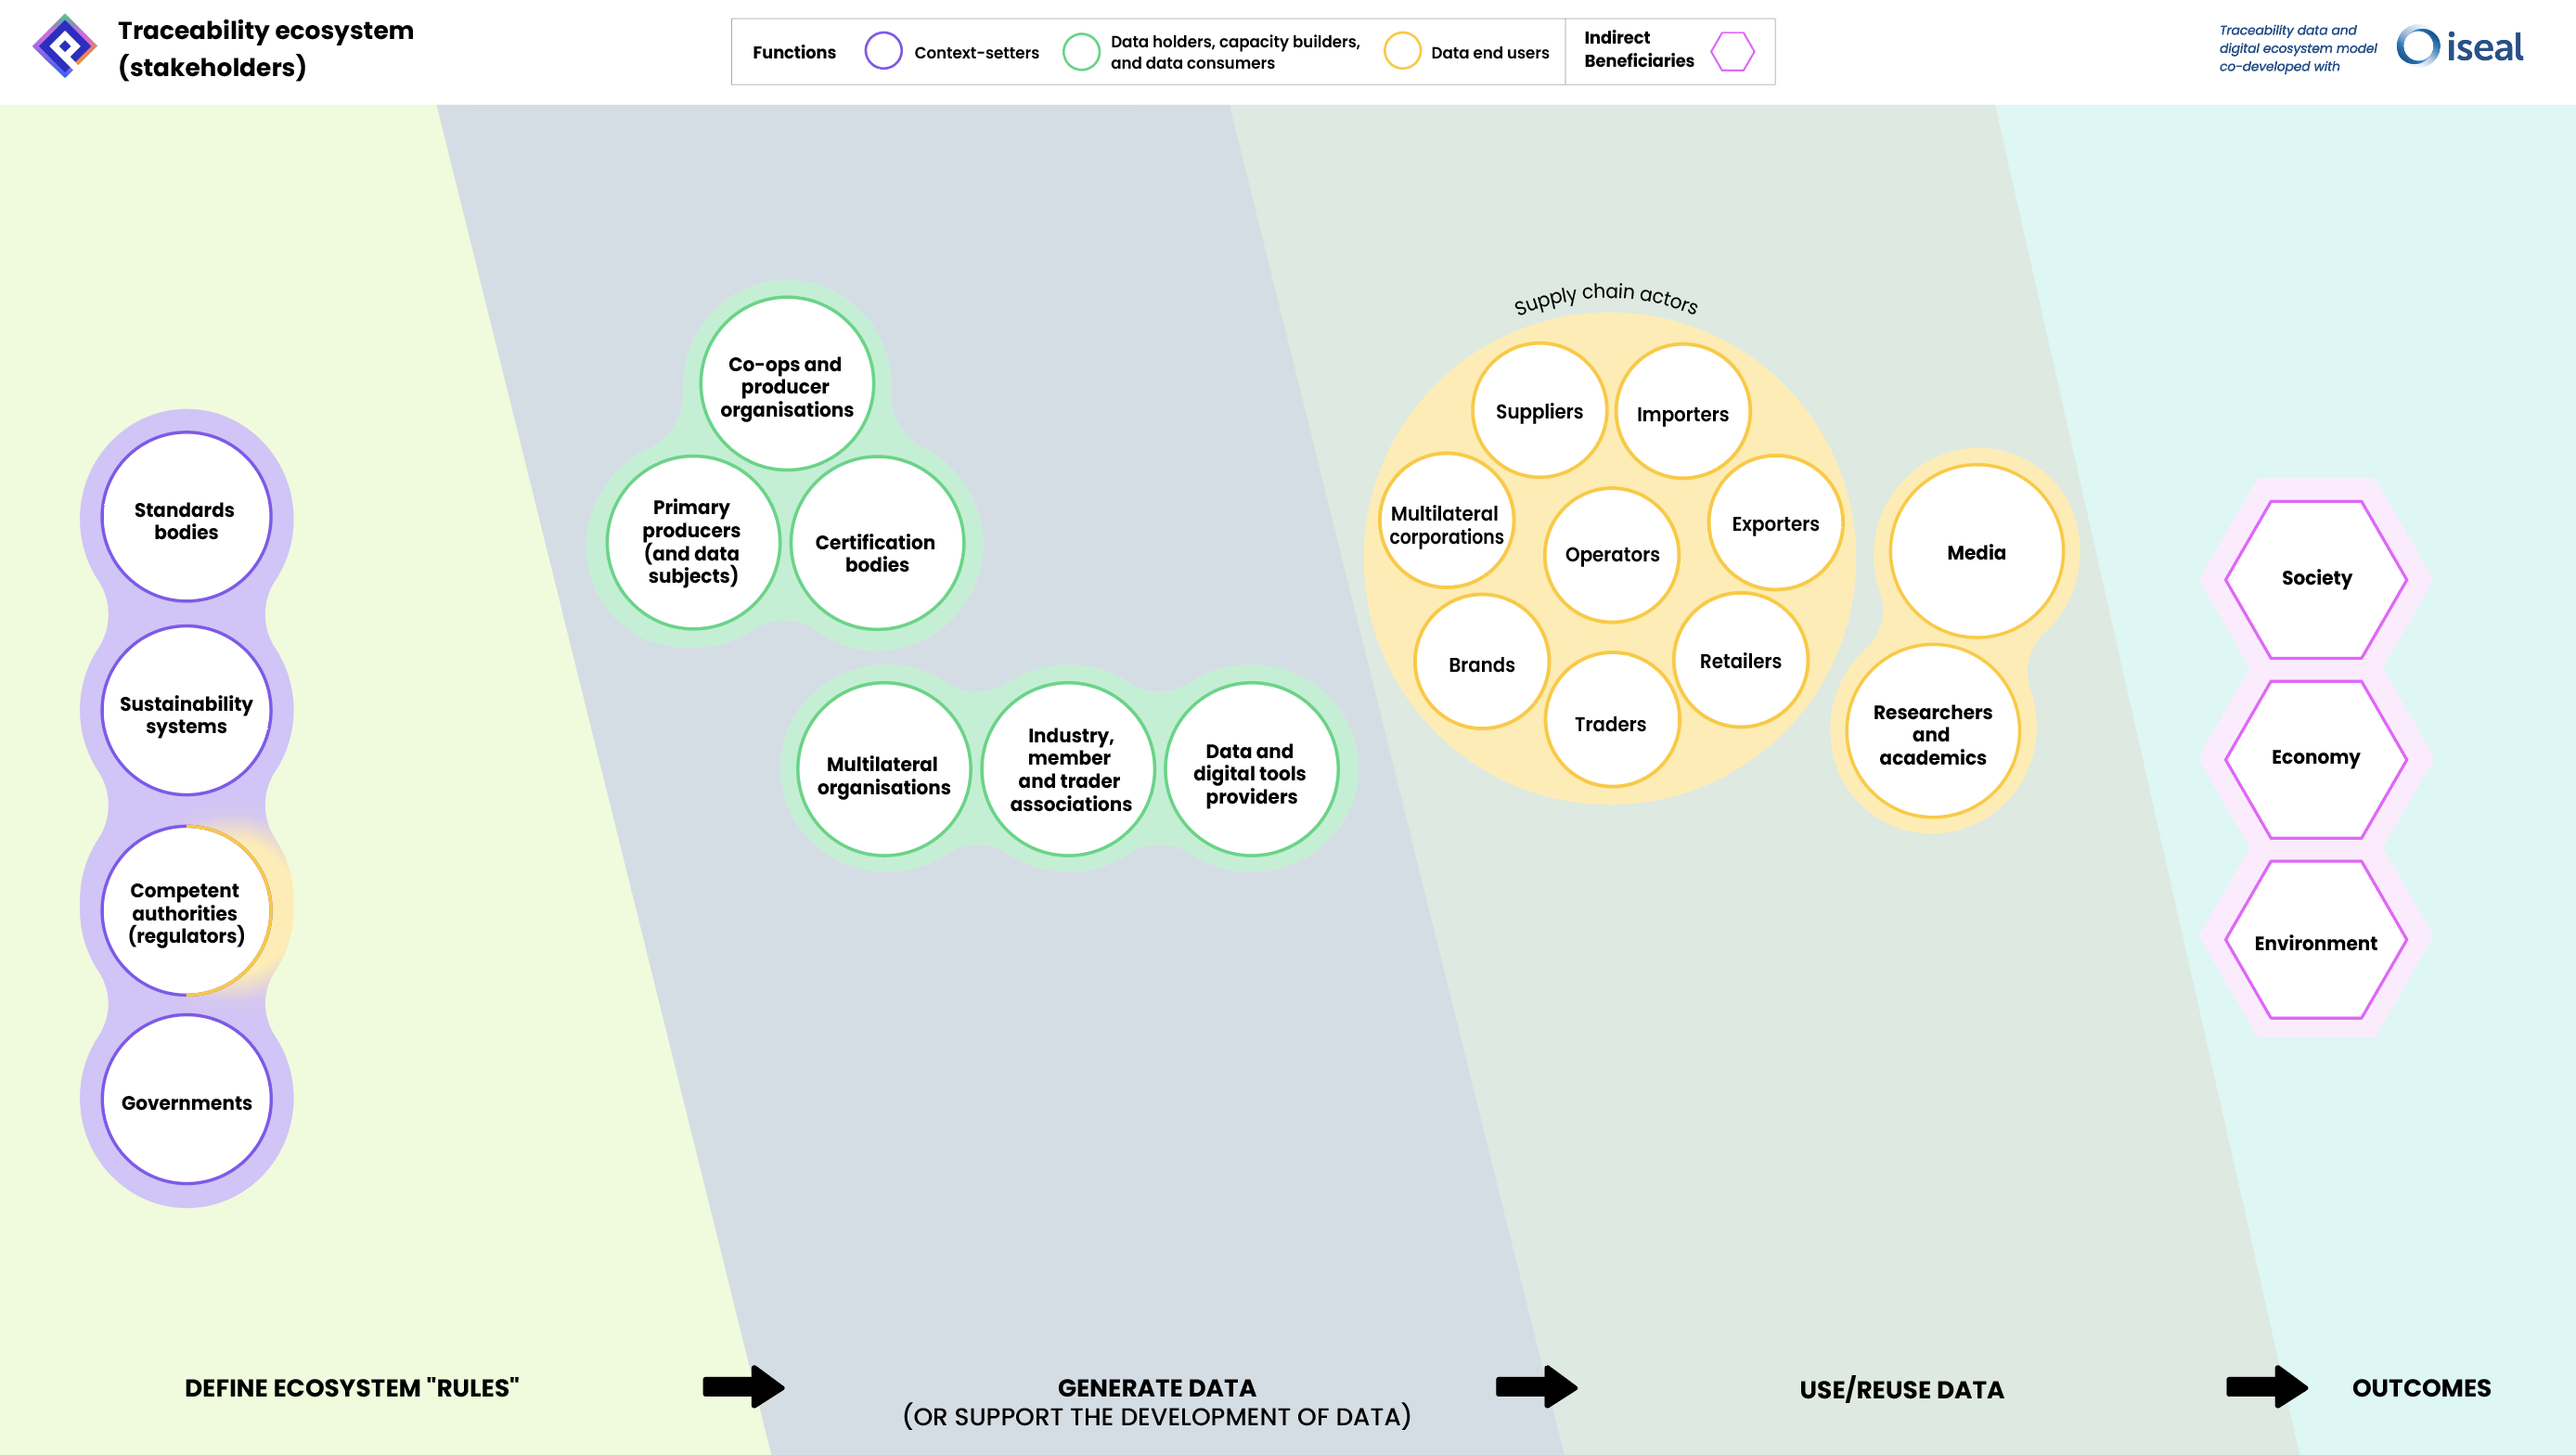
There are four main groupings in the traceability ecosystem:
- Context-setters: Stakeholders that set and enforce regulations and that define standards are context-setters. They help establish the "rules of engagement" and regulatory requirements that must be followed by any stakeholder wishing to participate in the traceability ecosystem.
- Data holders, capacity builders and data consumers: This category represents the stakeholders that collect, or support the collection of, data. This includes primary producers, co-ops and producer organisations (the data subjects that the data is about or who are custodians of the land that the data is about), verification and certification systems that may also collect and hold data, and capacity building organisations such as multilateral organisations, industry, member and trader associations, and data and digital tools providers. In some cases, capacity building organisations are also collecting and storing data and making the data available to stakeholders. In other cases, capacity building organisations are providing mechanisms (data governance processes or policies, registries, or digital tools) that assist data holders to better collect and manage their data. Some of these stakeholders are also data consumers: co-ops and producer organisations may not own the data but may consume data from producers in order to facilitate regulatory reporting, digital tools providers may consume the data to make assessments, or multilateral organisations building data registries may consume data to make it available to end users, where data holders have provided consent to share it.
- Supply chain actors and other data end users: This category represent stakeholders that make use of data and digital services. Primarily, these stakeholders are focused on using data to meet regulatory requirements such as conducting assessments and submitting due diligence reports, but they may also use this data for other purposes in future. For example, perhaps a supply chain actor wants to quickly identify a region where a majority of producers are already EUDR-compliant in order to increase their supply, or they may be looking for opportunities to optimise their logistics costs by consolidating producers of a commodity in one region if they can source sufficient EUDR-compliant suppliers in the one area. Other data end users like the media and academics may look for aggregated data on supply chain behaviour for analysis and reporting. Regulators (called competent authorities under the EUDR) are also data end users: they need to make use of the data supplied by supply chain actors in order to assess compliance or ensure market behaviour aligns with the goals and directives of the regulations they oversee.
- Indirect beneficiaries is the category of stakeholders that are presumed to benefit from ecosystem activities. These include society (for example, benefiting from greater trust and choice in access to sustainable products and from stronger enforcement of local laws like worker and Indigenous rights and prevention of child labour exploitation), local economies (for example, by supporting market access for small-scale producers that adopt sustainable practices), and the environment (for example, from reduced deforestation).
All stakeholders are defined in the following table:
Stakeholder | Type | Description |
Standard bodies | Context-setters | Broad standards organisations that define specific data standards and data models used across industry |
Sustainability systems | Context-setters | Sustainability standards schemes and voluntary sustainability standards (VSS) organisations that define standards used for certification by supply chain actors specifically related to sustainability |
Competent authorities (regulators) | Context-setters End data users | Defined bodies responsible for establishing regulatory compliance processes and for using and assessing data to ensure supply chain actors meet regulatory requirements |
Governments | Context-setters | Policy making government bodies that draft and implement legislations that set the regulatory context |
Co-ops/producer organisations | Data holders | Aggregated groups of (often standards certified) producers working as co-operatives or producer organisations made up of individual producers |
Primary producers (and data subjects) | Data holders | Individual producers with plots of land that are responsible for ensuring their farming practices meet deforestation and other regulatory requirements |
Certification bodies | Data holders | Capacity-building organisations that sometimes collect and store data from producers to ensure sustainability standards are met |
Multilateral organisations | Data holders | Capacity-building organisations creating tools and resources to address gaps and supporting producers to meet regulatory requirements |
Industry member and trader associations | Data holders | Capacity-building organisations that represent producers and/or other supply chain actors in meeting regulatory requirements |
Digital data and tools providers | Data holders | Stakeholders assisting other actors to meet regulatory requirements by providing datasets and/or digital tools to meet regulatory requirements |
Supply chain actors | End users | Importers, traders, retailers, brands, and other supply chain actors buying or using commodities from producers to provide products in the European market |
Media | End users | Organisations that use data to report on aspects of the traceability ecosystem to the public |
Researchers and academics | End users | Researchers that use data to analyse aspects of the traceability ecosystem |
Society | Indirect beneficiaries | Communities that buy, sell and use commodities made available in the European market and globally that benefit from improved digital systems and sustainable agriculture practices |
Economy | Indirect beneficiaries | Local economies of producers or end consumers that benefit from improved digital systems and sustainable agriculture practices |
Environment | Indirect beneficiaries | Global environments that benefit from reduced deforestation and better digital management of resources |
Common tools and infrastructure used across the traceability ecosystem
Digital public infrastructure components are the core hardware, software, tools, processes, policies, and platforms that support and reinforce the implementation of regulatory and standards requirements that govern the digital ecosystem.

Components tend to include:
- The regulations and standards themselves and any government policies that define how the industry sector must operate
- Data governance best practices and tools, including consent processes that ensure that data subjects maintain control over how their data is used throughout the ecosystem, and trust frameworks that can include tooling to enable responsible data sharing at scale without placing onerous requirements on data subjects to manage each flow of data about their commodity production
- Training and data governance resources that support stakeholders to collect and manage data equitably, securely, ethically and responsibly
- The datasets that are used to carry out ecosystem activities such as regulatory assessment and reporting or that enable supply chain innovation
- Digital tools that ensure data quality and that help manage data across the data life cycle (from data collection to use and sharing). This can include open source tooling and other digital public goods that are shared or can be used by any ecosystem stakeholder, as well as proprietary offerings that must be purchased or are only available to specific actors (such as members of a trader association). This can also include the hardware level and the cloud infrastructure that digital is built on.
- Analytical reports are data usage artefacts like due diligence reports or dashboards that present data in analysed and processed form to enable ecosystem activities.
The data life cycle within the traceability ecosystem
This model can also be useful to understand the positioning of ecosystem stakeholders and public infrastructure by overlaying the ecosystem model on the data life cycle. The data life cycle refers to all of the steps that are involved from data collection to data use and sharing:
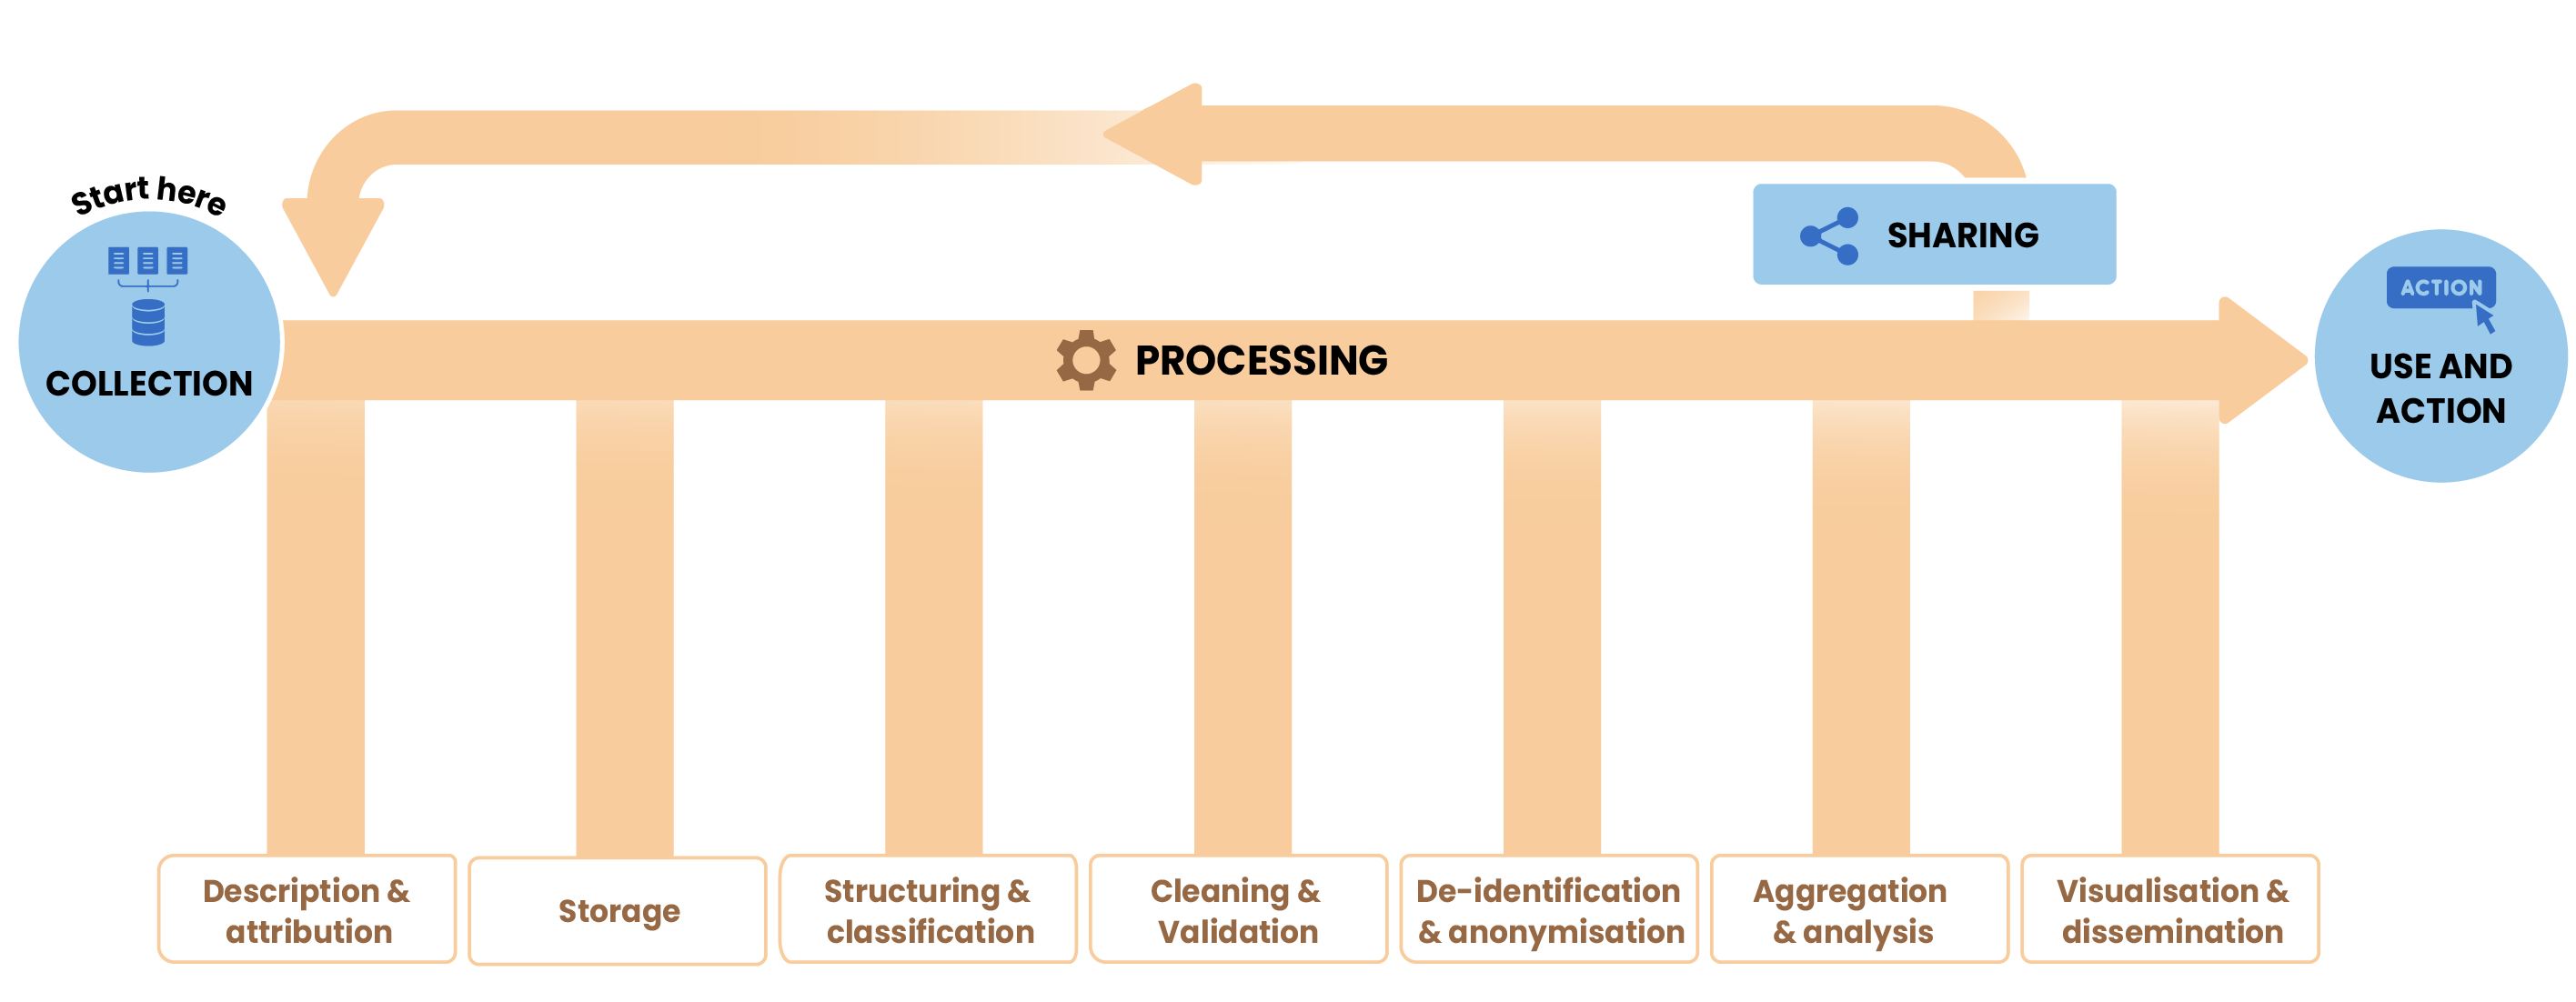
The data life cycle typically includes stages of collecting the data, attributing and classifying data, validating data accuracy, storing data, de-identifying, anonymising and aggregating data, analysing and visualising data, sharing data (including sharing data internally by combining it with other datasets and repeating the data life cycle flow) and using the data.
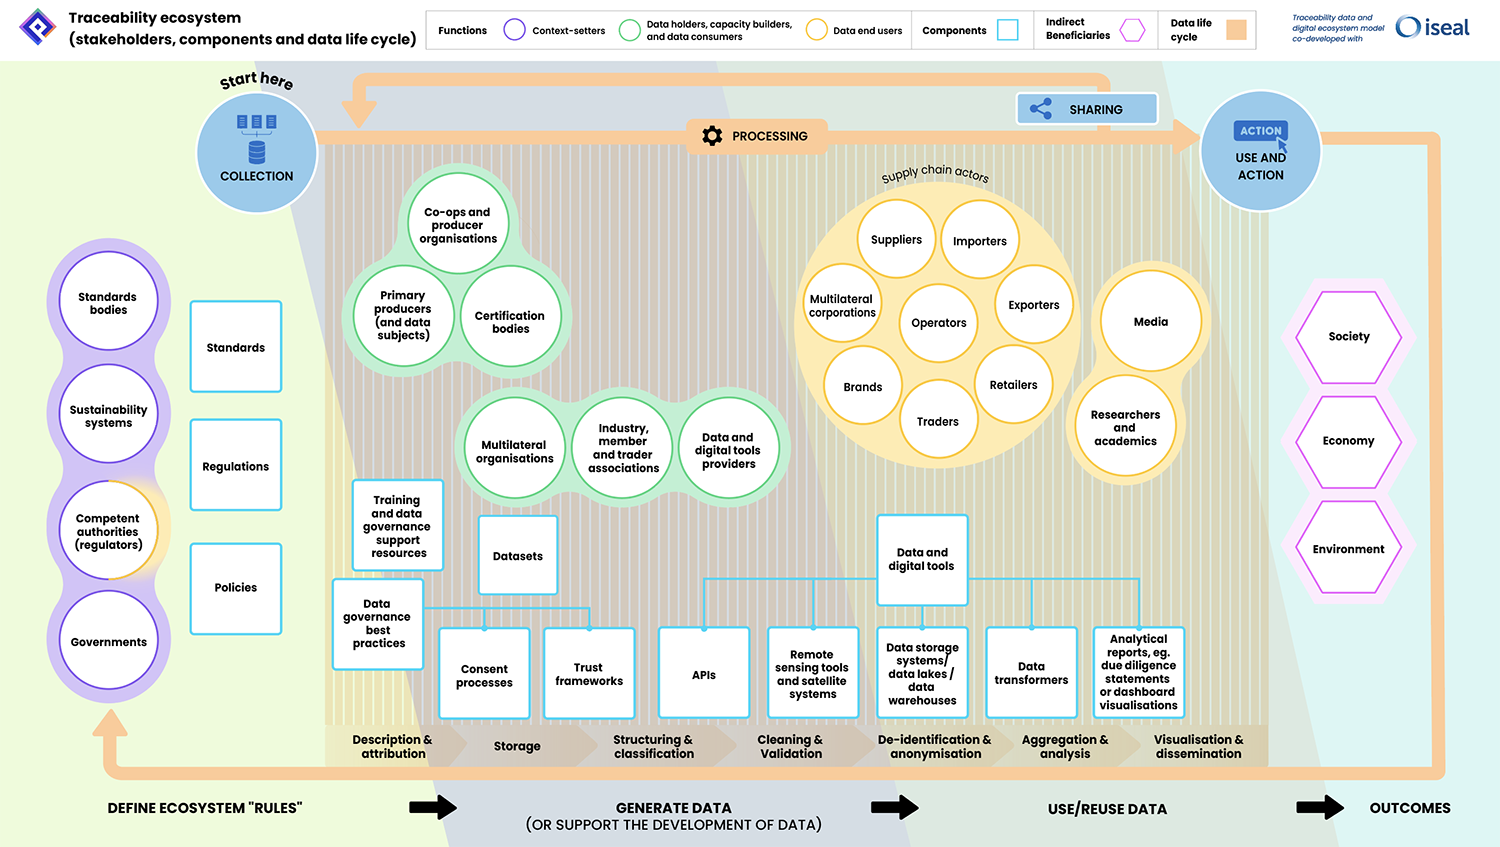
Context setters tend to sit outside the data life cycle but set the guardrails and 'rules of engagement' for how data may be collected and exchanged (and these regulations and standards help define the data models for what data needs to be collected and used through the data life cycle). Regulators, under EUDR referred to as competent authorities, are also end data users, as they take the due diligence reports and data prepared by operators and other supply chain actors to take their assessments and approve or reject commodity imports. Data holders, capacity builders and data consumers may collect or assist with preparing data for use across data life cycle stages. Supply chain actors and other end users tend to make use of data once it is shared. This includes regulators who review submitted data when providing due diligence certification approval (or rejection).
Creating your own version of the traceability ecosystem model
Our model is created at a generic, global open digital ecosystem level to demonstrate how stakeholders and common components work together. We find this mapping to be an essential part of ecosystem design and helps clarify opportunities, gaps, challenges, and potential partnerships. To be of use in your strategic planning and ecosystem design work, you will want to use this model to then start listing the stakeholders and components relevant to your perspective. Your perspective might be based on one of the following lenses:
Geographic: Perhaps you are only interested in mapping the stakeholders, regulations and components available in the geographic area where you operate.
Commodity-specific: Ecosystem maps would also look quite different depending on the commodity being addressed. This could be coupled with a geographic approach. Perhaps you are only interested in mapping the ecosystem related to coffee production in Việt Nam that is being imported into Europe. This may involve looking at all stakeholders that operate in these two areas and all related regulations, providers, etc.
Regulation-specific: We originally created this model with the EUDR in mind, but wanted to ensure it was future-proofed and flexible enough to be useful for analysis of the data and digital ecosystem supporting other regulatory compliance like human rights and environmental due diligence regulations and sustainability financial reporting requirements. While this can be useful as an initial analysis, we caution restricting the ecosystem model to one regulation only unless you have very specific needs for that level of granularity. One key concern at present is that there are a number of regulations that supply chain actors must comply with, and by analysing an ecosystem for one regulation will miss opportunities to reduce duplication and identify opportunities for interoperability when using data for multiple regulatory purposes.
Standards-specific: For a sustainability standards body looking to socialise its standards to new supply chain actors, or to compare the market size and needs of certified partners with the certified partners of a competing standard, mapping the ecosystem and identifying differences can help surface new opportunities to expand your membership base or help you increase activities and relationships in areas of membership strength.
Competition-focused (supply chain-specific): Similarly for other supply chain actors, mapping your digital ecosystem and creating a map for a key competitor (using any available information) and analysing the differences and competitive opportunities could support new strategic planning. For those collaborating with competitors on common ecosystem components like shared standards, digital tools, common data sets or mitigation investments, mapping the ecosystem from a competitive perspective can help you clarify when you are willing to coordinate and collaborate and when you want to maintain a competitive distance. It can also help clarify what data you are willing to share with the ecosystem and what you want to remain as commercial-in-confidence for example.
Using the traceability ecosystem model in your work
Using this ecosystem model, you can map the stakeholders and components relevant to your lens, as described above. With this resource, you can then apply our ecosystem design approaches: fostering an ecosystem mindset amongst decision-makers internally, defining your role and position in the ecosystem, using data to understand your ecosystem, conduct other types of ecosystem design analysis, create a data governance framework, implement API governance best practices, move towards an API contract approach, or start building an interoperability toolkit. You can always book a free discussion with us to explore how to take an ecosystem design approach in your work.
Below are some brainstormed ideas for how specific target markets could use ecosystem mapping and design approaches.

For voluntary sustainability standards bodies
Explore new ways to differentiate as standards and regulations align. Look for opportunities to support certified members that are part of multiple standards bodies. Identify opportunities and gaps where producer data-related burdens are high. Use ecosystem mapping as a tool in data product ideation.

For industry, membership, and trade associations
Identify participants who could work together on new projects. Identify areas of duplication and fragmentation that can be addressed. Identify common resources that could be explored including digital tools providers that would be useful to all members.
For multilateral organisations
Identify risks of fragmentation and duplication to address. Identify capacity building needs. Identify gaps in digital public infrastructure. Identify opportunities to improve interoperability. Source best practice examples and lighthouse projects.
For digital tools providers
Understand what regulations and data needs are facing potential customer segments. Identify data suppliers and other digital tools you could co-create with. Identify potential API consumer/developer segments.

For API tools providers
Understand how to enter the market and which areas are more API mature. Identify opportunities to offer specific product features or to better understand specific industry sector and market needs for API tooling.
For supply chain actors
Reduce data fragmentation and duplication risks. Identify best data sources and digital tools providers. Identify interoperability opportunities. Identify opportunities to improve data governance practices. Analyse gaps and opportunities to improve resource allocation through partnerships, improved logistics planning, identify new commodity sources and regulatory compliance-ready markets. Conduct data product ideation.

For researchers
Understand dynamics across the ecosystem and areas of research to explore. Use ecosystem maps as a mechanism for theory of change and hypothesis testing. Identify new research partners and new research cohorts to work with. Identify opportunities to improve participatory research approaches.
Article references

Mark Boyd
DIRECTORmark@platformable.com


